Phylogenetic age estimation, otherwise known as “divergence dating,” has a long and rich history that began in the 1960s. Two general classes of methods have emerged: a strict molecular clock, and a relaxed clock.
Age Estimates With a Strict Molecular Clock
A strict molecular clock means that observed mutations (“substitutions”) accumulate at a perfectly predictable rate. The end result is a tree with all leaves exactly the same distance from the root. Such a perfect tree is called “ultrametric.” It is very easy to estimate divergence times from an ultrametric tree. The TMRCA is equal to one-half the genetic distance between any two descendants, multiplied by the mutation rate. The rate can be estimated using any fossil or ancient calibrations within the tree.
In other words, T = D/2µ, where T = TMRCA, D = genetic distance, and µ = the mutation rate. The TMRCAs of unknown (uncalibrated) stems can then be estimated using one of several techniques. For example, linear regression, mean path lengths, or maximum likelihood optimization can be used. However, such perfect trees are far from reality, as decades of research have demonstrated.
Age Estimates With a Relaxed Clock
The alternative class of methods attempts to account for variation in the rate of accumulated mutations (“substitution rate”). Heterogeneity in substitution rate is sometimes called “heterotachy”.
In humans, heterotachy in the Y-DNA tree may occur due to a combination of interacting effects. One of the most commonly discussed reasons in the scientific literature is demographic fluctuation. For example, population bottlenecks, rapid population expansion, or changes in generation time are important.
Nearly Neutral Mutations
However, demographic fluctuation is not the whole story. Mutations with zero effect on phenotype (called “neutral”) are expected to accumulate at a constant rate regardless of population size. The catch is, most mutations are “nearly neutral”. Most mutations have a negligible effect on survival or reproduction. But when coupled with population growth, there is a noticeable effect on how many mutations accumulate. Large populations can purge deleterious mutations faster. Not all of these mutations have any effect. Some of them are simply hitchhiking with other Y-DNA mutations that do have some phenotypic effect. Even perfectly neutral mutations can accumulate faster if the population is oscillating in size and/or families have overlapping generations. Whatever the cause, some human Y-DNA stems are too long or too short to have experienced a strict clock.
When To Use a Relaxed Clock Method
When a strict clock does not fit, this second class of methods uses a relaxed clock. Essentially, each stem is allowed to have its own local substitution rate. The challenge is identifying which stems have significantly different rates than others. This can be done either manually for a few stems of interest or automatically for all stems. Then, TMRCAs can be calculated by maximum likelihood or Bayesian optimization. Alternatively, the stem rates and haplogroup TMRCAs can be simultaneously estimated by minimizing the errors in both. Often, this is done by assuming all local rates fit a particular distribution, and then drawing a rate for each stem that fits best. In some cases, rates are assumed to be correlated, i.e., nearby stems have similar rates. But this is more computationally challenging and may not make biological sense. Relaxed clocks with independent rates for every stem are said to be uncorrelated.
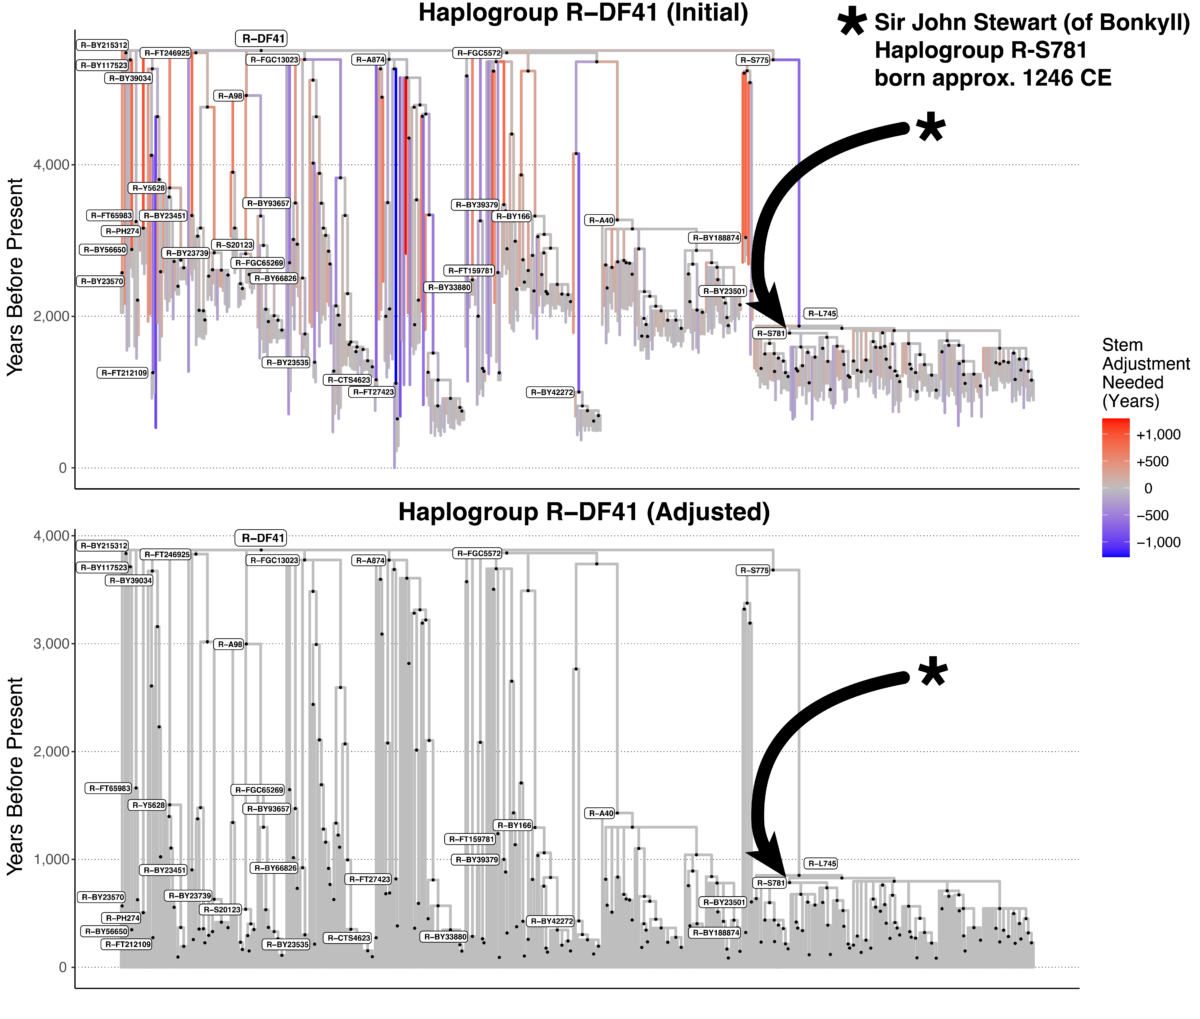
A Closer Look at Sir John Stewart of Bonkyll
Our method of divergence dating for the Big Y tree with > 50,000 stems began with a strict clock assumption. After receiving lots of great feedback and validation data, we found an uncorrelated relaxed clock model to be more accurate. Let us consider Sir John Stewart (of Bonkyll; born c. 1246 CE) as an example to illustrate how our method has changed. Previously, our method estimated a mean path length (MPL) of 1397 CE. That is, if you summed the number of years from each Big Y tester up to R-S781, the mean was 625 years before the present year of 2022 CE. However, this initial estimate was not the final one. To remove the paradoxes caused by some MPLs being older than their parent stems, we adjusted R-S871 by a factor of 89%. Our final estimate of R-S781 was thus 556 years ago, or 1466 CE (rounded to 1500 CE). Needless to say, our estimate was hundreds of years after Stewart’s birth. It did not even include the correct value within the 95% confidence interval.
How a Relaxed Clock Model Affected Sir John Stewart of Bonkyll’s Age Estimate
Most of this discrepancy was caused by long stems with rate changes. For example, almost directly above Stewart is an ancestor haplogroup called R-L745. Assuming a strict clock (121 years per SNP after considering the coverage level), the stem above L745 would be 3,513 years long. But after considering the lengths of all the stems across the tree and the validation data, a more reasonable value for that stem is 2,830 years. That means the molecular clock
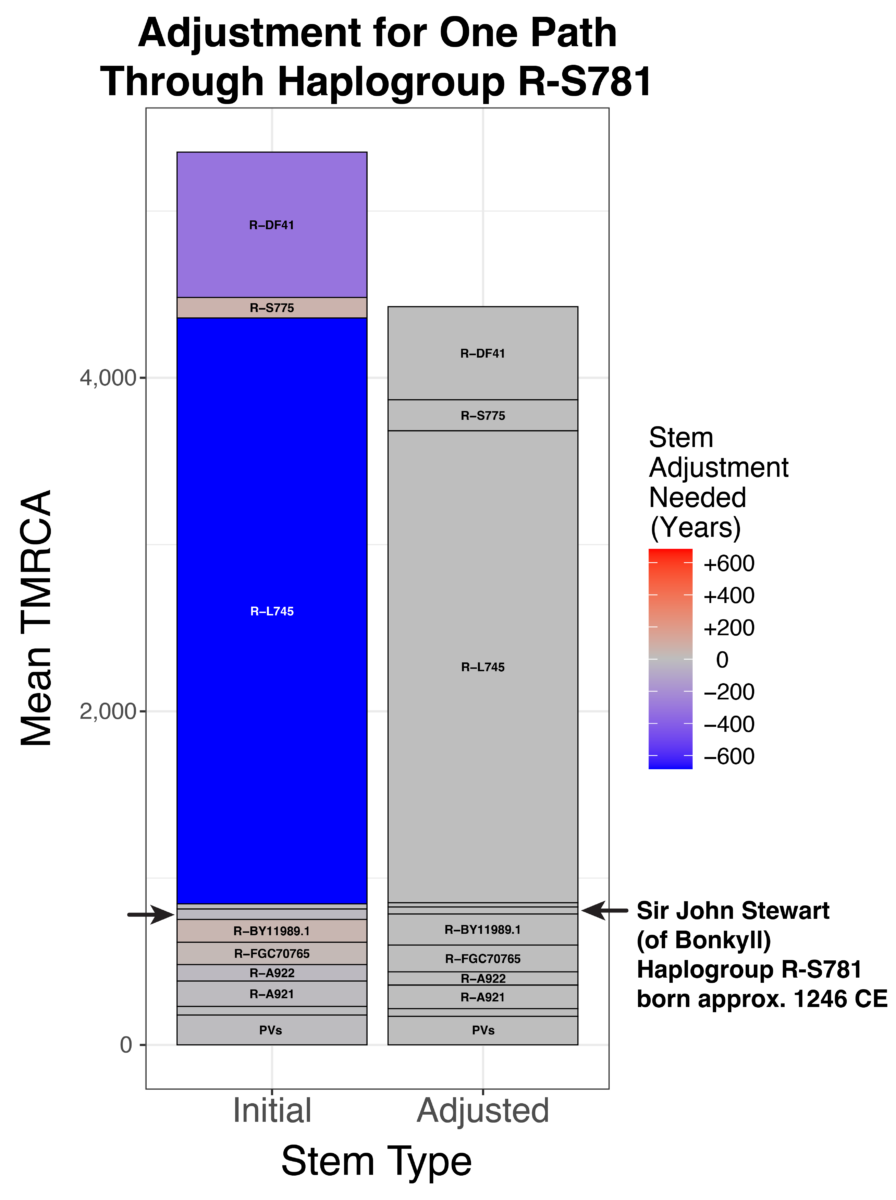
sped up to 98 years per SNP for that time period. Thus, 683 years were removed from that stem’s initial estimate. A shorter stem above Stewart’s haplogroup helps to make his TMRCA older. Using this new method, our TMRCA estimate is almost spot on: 785 years ago, or 1237 CE (rounded to 1250 CE).
A detailed description of our entire pipeline will be released in our upcoming white paper. However, it is important to mention a few details. One method that continues to work well (and has not changed) is our integration of SNP and STR data. For haplogroups < 2,000 years old, we estimate SNP and STR-based stem lengths, and average the two. We also carefully calculate coverage level when converting SNPs into years. In other words, T = S / (μ × C) where S = number of SNPs, and C = coverage for that stem. SNPs and STRs are combined using a general additive model.
The Future of FamilyTreeDNA Age Estimates
We are very excited to share our updated (Beta 2) release of our Big Y age estimates!
You can help us improve the estimates by:
- Specifying birth years on your Big Y kits
- Documenting your patrilineal genealogy in your family tree with accurate names and birth years
- Linking Y-DNA matches with whom you share a known most recent common ancestor
This information is used for our validations and to calibrate the tree. Our age estimates will continue to change as new customers test with Big Y-700 and we improve the algorithm.
Looks promising to more accurately learn new facts re: my family network.
BD 1967 Arkansas
Question: doesn’t every self-submitted Big Y kit contain the birthdate and Signature of the tester? Mine did –
In other words – doesn’t family tree already have this information for the vast majority of kits? On the permission to test papers?
what is the haplo group of the Fitzalan family
Hi there!
If you’re from the FtizAlan line, the best thing to do would be to test with us. While we currently do not have a FitzAlan project, we do have a Royal Stewart project that could help. Ultimately, the best option would be to test and see for yourself!