The FTDNATiP™ Report predicts the time to the most recent common ancestor (MRCA) of your Y-STR matches. The original report has been around as long as FamilyTreeDNA and our Y-STR tests. Over the years, we have received feedback that it needed an update. We are excited to present the new FTDNATiP™ Report with updates to our age estimation algorithms!
This article is a brief overview of the new FTDNATiP™ Report. For more information, visit our Help Center article.
Y-STR Matching
The main feature of FamilyTreeDNA’s Y-STR tests (Y-37 and Y-111) are matches. Like most DNA tests for genealogy, the test is most useful when compared to other people. When you have a Y-STR match with someone, you know that you have a patrilineal relationship with each other, sharing a direct paternal line ancestor sometime back in history.
The next question for any genealogist will be, “Whose ancestor was it?” When that is not obvious from comparing known genealogies, the genetic distance is the metric we use to compare and estimate how far back in time the connection goes. Is the connection in recent times, just behind that genealogical brick wall, or in ancient, prehistoric times? That’s the question we ask ourselves as we are looking at our match lists with names and earliest known ancestors.
The FTDNATiP™ Report (TiP for Time Predictor) translates the Genetic Distance (GD) into a time unit so that we can make use of it for genealogy.
The Old FTDNATiP™ Report
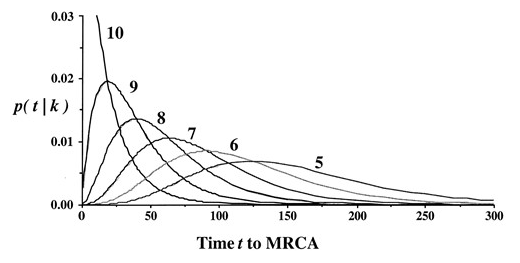
The original FTDNATiP™ Report was based on research by Bruce Walsh, Professor at the University of Arizona, and his 2001 paper in Genetics. Walsh used a theoretical approach to model STR mutation rates and estimate when two people’s’ paths diverged in the Y-DNA haplotree. He used an infinite allele model, which theoretically accounts for markers mutating more than once, which can obscure the true mutation rate.
Evolution of Y-DNA Age Estimates
Last year we announced the new Age Estimates based on the Big Y-700 test. The millions of slow-mutating Y-SNP markers tested by Big Y together with the faster-mutating but fewer Y-STR markers give state-of-the-art estimates for the Time to Most Recent Common Ancestor (TMRCA) of each branch on the Y-DNA haplotree.
We have also used thousands of known genealogical relatives and ancient DNA samples from many different time periods to validate these results, something that was only dreamt of back in 2001. These dates are not factored into our algorithm but are instead used to validate that our algorithms are accurate. As any genealogist knows, these dates should be taken with a grain of salt individually, but collectively, they can provide a good benchmark dataset.
Note: You can help the cause by linking your Big Y matches with a known genealogical connection on your family tree.
These new age estimates are best viewed on the new Time Tree, which shows how all Big Y testers are related on their direct paternal lines.
Age Estimates for Y-STR tests
But what if you haven’t yet upgraded to the Big Y-700 test or if one of your intriguing Y-STR matches at the Y-12, Y-25, Y-37, Y-67, or Y-111 levels is not available to upgrade to the Big Y-700?
The original report provided an estimated number of generations to the most recent common ancestor (MRCA) for each Y-STR match. But many customers have contacted us throughout the years and asked for an update to the report, as it was often giving estimates that were too optimistic (young).
This is where the updated FTDNATiP™ Report comes in. Our Research & Development team used Big Y haplotree TMRCA estimates from hundreds of thousands of pairs of Y-STR results from Big Y testers and built models to predict the most likely TMRCA ranges for each Y-STR marker level and genetic distance.
Accessing the FTDNATiP™ Report
To access the new report, head to your Y-DNA matches. For each match, click on the graph icon in the top right corner. This will take you to each FTDNATiP™ Report for your Y-DNA matches.
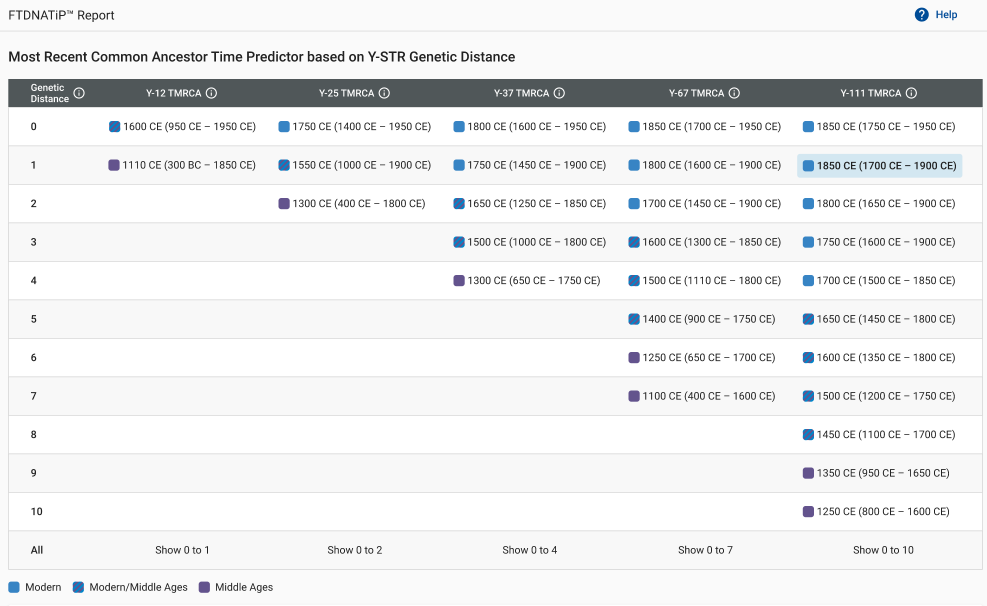
When you view the chart for the Y-111 level, there are many more GD levels displayed compared to the Y-12 level. Clicking on each GD level will provide a unique probability estimate.
You will notice the highest possible GD on the chart is 10 for 111 markers. In the last row, there is an option to show the entire range simultaneously.
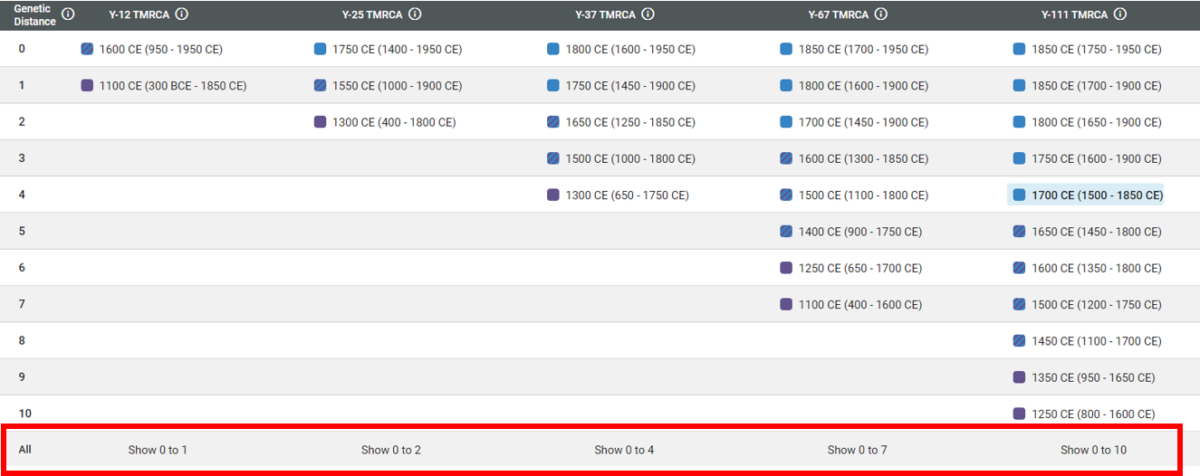
Clicking on one of these options will display all possible GD ranges for that marker level.

Understanding the New FTDNATiP™ Report
When you receive your Y-DNA results, you will be able to access your Y-DNA matches. With this list of matches, we provide Genetic Distance (GD). But what does that mean, and how are you related?
Genetic Distance in the FTDNATiP™ Report
Genetic Distance (GD) refers to the number of differences in Short Tandem Repeats, or Y-STR markers, between two people. As generations go by, slight copy errors in genes (called mutations) occur that cause the value of these markers to change.
These mutations are only slight differences, but they tend to accumulate as more generations go by. This means that the further apart two different lineages are from their shared common ancestor, the more differences the two lineages will have in their Y-STR values.
Each difference in a Y-STR value counts towards the overall GD, but these mutations do not occur in every generation. Sometimes many generations can pass without a Y-STR change. This is because GD does not have a one-to-one ratio with the number of generations to the common ancestor. However, the more markers you look at, the more precisely you can see how different the two people are.
Imagine having two puzzles, each with 111 pieces. If you compare just 12 of those pieces and they all match perfectly, you might think they are identical puzzles. However, the more pieces you compare, the more you can see if they are identical or not.
A match of 12 for 12 in Y-STR markers is good, but a match of 111 out of 111 markers is even better. The 111 match probably has a closer shared ancestor with you. This is sometimes referred to as “higher resolution.”
Combining SNPs and Genetic Distance
In order to understand how the Genetic Distance Age Estimates are calculated, you will need to understand the importance of Y-SNPs.
Take two Big Y-700 testers who match each other with a genetic distance of 2 at the Y-37 STR marker level. Next, take a look at their confirmed haplogroups. These haplogroups are each determined by a specific mutation that occurred in a man and was passed down; this mutation is known as a Y-SNP.
If the two testers have different haplogroups, you can trace the two haplogroups back on the tree to the “parent” Y-SNP. This Y-SNP will have an age estimate as well.
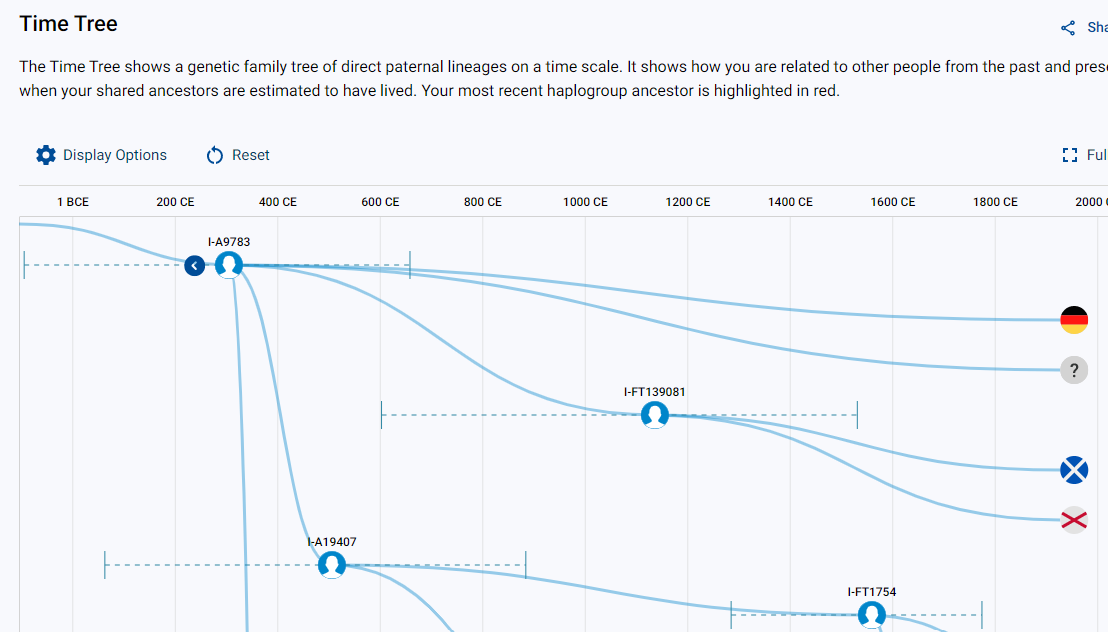
So in our example, the two testers match but have different haplogroups of I-FT139081 and I-A19407. The “parent” Y-SNP of both of these is I-A9783. This means that I-A9783 represents the common ancestor for the two matches. Therefore, the birth year of the man who carried the Y-SNP for haplogroup I-A9783 is also the TMRCA for the two matches.
If you were to expand your search to all the people in the database who match each other with a GD of 2 at the 37 marker level and find the ancestral Y-SNP for each pair of matches, you’ll see each genetic distance is unique to each pair. When we combine all of these age estimates, we get a distribution.
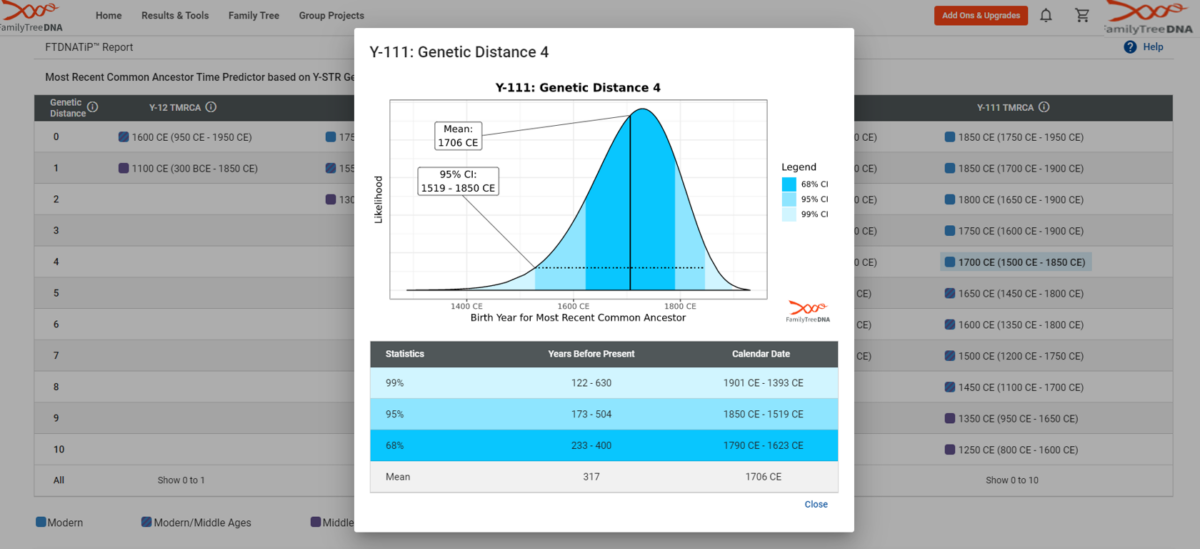
Confidence Intervals
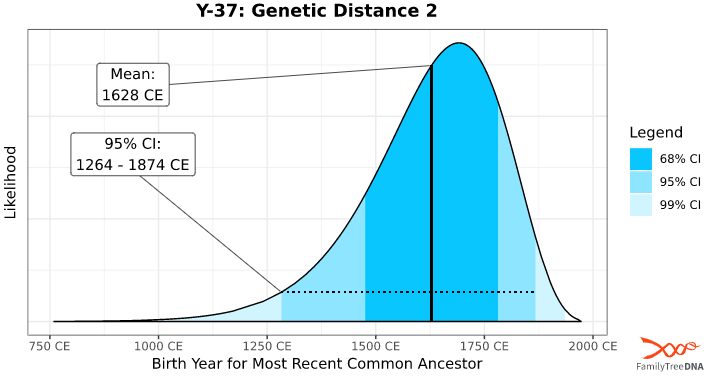
Once we have established the TMRCA for a given match level, we can accurately predict the TMRCA for anyone at that match level. How confident are we in these predictions, though?
The confidence interval (CI) graph is broken down into three color-coded sections, as designated in the legend to the right of the graph. This refers to the likelihood of matches who share a Y-SNP of a given age range. 99% includes all age ranges currently in our database since there may be matches who share a Y-SNP outside this age range who have not yet tested.
The higher the confidence interval, the more likely a tester in the database has that age range. As the CI decreases, the risk that your shared Y-SNP is outside this age range increases, along with the possibility of inferring incorrect information.
For this reason, we offer three levels of confidence intervals. Most genealogists recommend the 95% CI.This same technique was done for all possible genetic distances at all possible Y-STR matching levels in the FTDNATiP™ Report.
Outlier Ancestors
One common question we get is why a known common ancestor does not fall within the predicted range. Remember that this range is based in large part on the Big Y Age Estimates. One thing that is known to affect the time estimate are null values. Null values occur when the lab is unable to find the value for a particular Y-STR marker. This can happen for a number of reasons. You can read more about null values and how they affect genetic distance.
For more information about how these age estimates were calculated, check out our Help Center article.
Receive the Highest Resolution for Yourself
As we mentioned before, you can get the most out of your results when you have all the pieces. Consider upgrading your Y-DNA results and see the difference for yourself!
This report would not be possible without Dr. Bruce Walsh and Dr. Paul Maier. A big thank you to Bruce Walsh for his hard work in pioneering the science behind this report. And also to Paul Maier for helping to improve its precision.
This is a great improvement. I especially like the fact that you focus on the range of years, giving a great sense of the precision of the information.