60+ New Reference Populations Added
After months of waiting, it’s finally here! FamilyTreeDNA (FTDNA) is excited to bring you myOrigins 3.0!
FamilyTreeDNA’s Population Geneticist Dr. Paul Maier and the FTDNA Research Department along with dozens of others in our lab, IT, and marketing have been developing this update for nearly two years, and we’re so excited to start releasing it to our customers.
Starting on Tuesday, September 22, 2020, thousands of customers will receive this update. More will receive their update each week, and you’ll receive an email notification once your new results are posted. If you haven’t received your new results yet, you can sign in to your kit and view when they are expected under the “updates” section on the dashboard.
FTDNA first added myOrigins to our autosomal test in 2014 and provided ethnicity estimates in comparison to 18 population clusters and 4 blended clusters. In 2017, we released our first update to myOrigins (2.0), which compared your autosomal DNA to 24 reference populations. The new myOrigins 3.0 brings a major update and expansion to your Family Finder results.
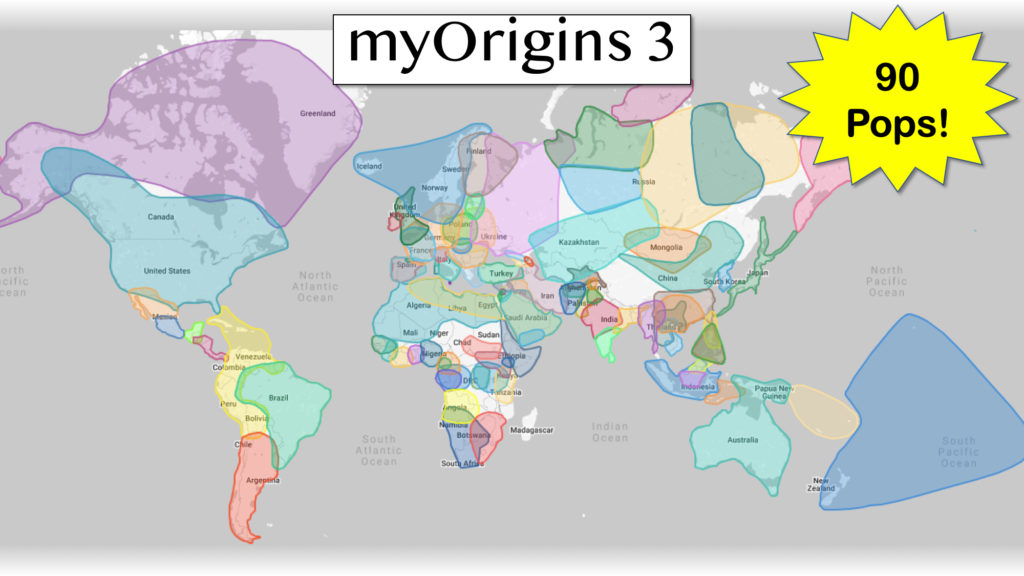
The new myOrigins 3.0 compares your autosomal DNA to 90 reference populations and improves the methodology behind the calculations used to determine your ethnicity estimates.
Starting this week, each customer with existing Family Finder results or pending Family Finder results will receive the new ethnicity estimates free of charge, and we’ll send out an email once your new results are posted to your account. Each new Family Finder purchased or autosomal transfer unlocked will receive this latest version of myOrigins when the results are ready.
How will this impact my existing results?
Depending on where your ancestors are from, you might see a major difference in your new myOrigins results compared to your old results. With this update, we’re going from just 24 populations to 90 populations, so that’s a big jump and a big change in the number of populations that your DNA might match.
[rev_slider alias=”MO3 Populations”]
- For Africa, we’ve expanded from 4 reference populations with myOrigins 2.0 to 21 reference populations with myOrigins 3.0.
- For Asia and Oceania, we’ve expanded from 6 reference populations with myOrigins 2.0 to 33 reference populations with myOrigins 3.0.
- For the Americas, we’ve expanded from 2 reference populations with myOrigins 2.0 to 9 reference populations with myOrigins 3.0.
- For Europe and the Middle East, we’ve expanded from 12 reference populations with myOrigins 2.0 to 27 reference populations with myOrigins 3.0.
We’ve also improved the methodology behind the calculations we use to determine your results in order to make sure our ethnicity estimates are as accurate as they can be.
How does this all work anyway? What is a reference population and how do you calculate my results?
A reference population cluster is created when population geneticists find groups of people with similar heritage (for example, all 4 grandparents are from the exact same place) and group them together. Each reference population cluster goes through extensive testing before it is solidified and approved.
In general, DNA testing companies use a combination of academic reference population clusters and those built from their own testing databases to create their core group of reference populations. Because of this, each company will have slightly different estimates for each tester.
Each tester is compared to those reference population clusters and a calculation is given for how much of their DNA matches each cluster. That calculation is based on methodology crafted by the population geneticists and researchers of each company, so this is another reason your results can vary from company to company or from one update to another if that methodology is improved, like what has happened with the myOrigins 3.0 update.
These results are of course all estimates. On the continental level or if a tester is from a population that was or still is incredibly isolated, genetic differences are easily divided and determined. At the subcontinental level, many population groups over the course of the past 500 to 2000 years experienced high mobility and interaction and because of that, the genetic differences are minor, so random recombination can play a role in whether a tester’s result matches the region their ancestors are from or a region neighboring it.
Another reason this can vary so much is that it’s looking for the closest estimate to what your DNA matches. When new reference populations are added into the mixture or if you test with a new company that has completely different reference populations or is looking at a different data set of autosomal SNPs, you may end up with a different story of where your ancestors came from. While we’re looking for the closest match to your DNA, if your ancestors come from a population that is not represented, we will find your nearest DNA neighbor.
How does it work? How far back is this looking? At which ancestors?
Everyone inherits 50% of their DNA from each parent, so a tester should have 50% of each of their ancestors’ ethnicity estimates, right? Not exactly. Autosomal DNA is passed down through random recombination. This means you aren’t inheriting a perfect half of each parent’s ethnic percentages.
When autosomal DNA is passed down from each parent, the DNA remixes itself, and you receive a randomized selection of half of each parents’ autosomal DNA. The same happened when they received theirs from their parents, and they from their parents, and so on, which means unless all of your ancestors are from the same location, you may not inherit the portion of matching DNA for a specific reference population.
Because you’re only receiving a random half of the previous generation’s autosomal DNA, by the time you get to about the 5th or 6th generation back, you’ve received at best a trace percentage of their DNA. This is part of why it’s important to test older generations as well.
Random recombination will also cause siblings’ inherited percentages to be different from each other as well, so if you are looking for that specific population, it’s a good idea to test as many people as you can. Siblings will share on average only about 50% of the same autosomal DNA with each other.
The random recombination process can sometimes cause some autosomal DNA to remix to look like a nearby reference population that is not seen in either parent or to appear in a greater percentage for a reference population than seen in either parent combined. This is completely normal. I’ve tested myself, my two sisters, and both of our parents, and we’re a good example of this situation. Our percentages are below:
Dad (John):
- Central Europe:37%
- Scandinavia: 28%
- Great Britain: 20%
- Ireland: 15%
Mom (Barbra):
- Scandinavia: 2%
- Great Britain: 43%
- Ireland:46%
- Baltic:3%
- Sardinia: 3%
- East Slavic: 3%
- Trace: Amerindian– North Mexico
Me (Katy):
- Scandinavia: 5%
- Great Britain: 76%
- Ireland: 10%
- Greece and Balkans: 5%
- Baltic: 3%
- Trace: Amerindian — Andes and Caribbean, Amazon
Sister 1 (Becky):
- Scandinavia: 24%
- Great Britain: 7%
- Ireland: 55%
- West Slavic: 6%
- Greece and Balkans:5%
- Iberian Peninsula: 3%
Sister 2 (Christie):
- Scandinavia: 29%
- Great Britain: 7%
- Ireland: 53%
- Iberian Peninsula: 6%
- Magyar: 4%
- Trace: Amerindian– Argentina and Chile
Looking at these results, I’ve inherited a higher percentage of Great Britain than either of my parents have combined. However, I have a much smaller percentage of Ireland than both of my parents combined, and the genetic heritage of these two populations is closely related. A small change through the random recombination process when that DNA is passed down is all it would take for those extra segments of DNA to show up matching the Great Britain reference population more closely than they match the Ireland reference population.
The same goes for the seemingly odd appearance of the Greece and Balkans, West Slavic, Iberian Peninsula, and Magyar percentages in my and my sisters’ results. These populations do not appear in either of my parents’ results, but they do surround the Central Europe population seen in our dad’s results and have a long history of interaction with that region.
This can also be applied to the difference in Amerindian populations in the trace results between my mom’s results (North Mexico) and my and one of my sister’s results (Andes and the Caribbean, Amazon, and Argentina, and Chile).
Each sibling also inherited a completely different mixture of ethnicity estimates from the other. If we were looking for evidence of Native American ancestors and had only tested Becky, we would not find that evidence through DNA, due to random recombination.
Neither myself nor my sisters have inherited a perfect half of our parents’ ethnic percentages.
Genealogy-wise, my family hasn’t been able to trace all of our ancestral lines out of the US, but so far, we have traced some of them back to Ireland, Scotland, England, and Central Europe. These results do fit with what we know so far about our ancestors, and since my personal myOrigins 2.0 results were nearly 100% British Isles, it’s neat to see some additional refinement.
What’s coming next? Will my ethnicity percentages continue to change?
FamilyTreeDNA always works to improve the information we’re able to bring to our customers, so we will continue to find new ways to adjust the methodology behind the algorithm that calculates your ethnicity estimates and find new reference populations to add. However, these improvements take a lot of testing and time to implement, so another update to your percentages is not likely in the near future.
However, we are working on additional tools and features that will improve the information you receive and your ability to use it in conjunction with your genealogy.
At the beginning of 2020, Dr. Maier gave a sneak preview of one of these new features at the RootsTech conference.
We’re still working to add a chromosome ethnicity painting feature to your myOrigins results so you can view a breakdown of exactly where on your chromosomes each of these percentages matches up, that way you can see what parts of your genome are from which parts of the world. This will also allow you to compare these segments with your matches to find and identify common ancestors from a specific population.
We’ll have further information about this additional feature and perhaps others in 2021.
How can I receive these new updates?
If you already have a Family Finder test, sign in to your kit, and check your myOrigins results. If you’ve received the update already, it will say “Version 3” at the top, and you will have also received an email from FamilyTreeDNA letting you know your new results are here. If it still says “Version 2,” go back to your Dashboard, and check the “updates” section to find a notice about how soon you can expect your new results to be in.
If you don’t have a Family Finder already, you can purchase one today! If you have previously tested with FamilyTreeDNA, sign in to your kit and click Add Ons & Upgrades, and we’ll process the sample you have already provided.
If you have not yet tested with FamilyTreeDNA, you can purchase a Family Finder here: https://www.familytreedna.com/products/family-finder
If you have previously tested with Ancestry, 23andme, or MyHeritage, you can transfer those autosomal DNA results to FamilyTreeDNA for Family Finder results here: https://www.familytreedna.com/autosomal-transfer
If you’d like to see a full list of all 90 new populations, you can find that list here: https://www.familytreedna.com/learn/user-guide/family-finder-myftdna/myorigins-population-clusters/
Strange results. On my V2 results i was 18% Scandinavian, now on V3 i am now only 3% Scandinavian. I am sceptical about this new release to say the least.
Hi Barry!
With version 3, the population clusters are more refined based on new research and new reference populations that have been collected and published since the myOrigins feature was first released in 2014. We’ve also improved the methodology behind the calculations we use to determine the results in order to make sure our ethnicity estimates are as accurate as they can be. You can find more information in the whitepaper.