By: Katy Rowe-Schurwanz
Explore the Autosomal DNA Series
Start with the basics, then continue through the series to learn how autosomal DNA works, what your results mean, and how to use them in genealogy.
- What Is Autosomal DNA?
- How Autosomal DNA Testing Works
- How to Interpret DNA Matches
- Understanding DNA Ethnicity and Origin Results (current article)
Learn how to interpret your autosomal DNA origins using myOrigins®, Chromosome Painter, ancientOrigins, and haplogroups.
Autosomal DNA testing provides more than just matches—it also offers insight into where your ancestors likely lived. These “origin” results are based on genetic similarities to populations and can help add geographic and historical context to your family tree.
These results are often called “ethnicity estimates,” but they reflect genetic similarities to populations—not cultural or social identity.
In this article, you’ll learn how to interpret your origin results using tools like myOrigins, Chromosome Painter, ancientOrigins, and Y-DNA haplogroups.
What Do “Origin” Results Show in Autosomal DNA?
Autosomal DNA origin results compare your DNA to reference populations to estimate where your ancestors likely lived. These results reflect genetic similarities to populations—often called DNA ethnicity results—and are presented through tools like myOrigins, Chromosome Painter, and ancientOrigins.
What DNA Origin Reports Are Included in Family Finder™ Results?
Family Finder results are available to anyone who has taken the Family Finder autosomal DNA test or uploaded their DNA data through an autosomal transfer.
If you have transferred your DNA results from another testing service, you can upload your data for free and access your DNA matches and basic tools. Additional features, including more advanced origin reports, become available after unlocking your full results.
Genetic genealogists use these tools and reports together to identify shared ancestors and validate research. These reports help you explore your ancestry from different perspectives—ranging from recent population estimates to deep ancestral connections.
Family Finder includes the following reports and tools:
Matches* | Matrix* | Chromosome Browser** | myOrigins | Chromosome Painter | ancientOrigins | Y-DNA Haplogroup
(* Covered in the previous article in this series)
What Is myOrigins?
myOrigins is a feature of the Family Finder test that estimates your ancestral origins by comparing your autosomal DNA to reference populations. Your results are shown as percentages representing how closely your DNA matches each population.
What Are Population Clusters?
Population clusters are groups of people who share similar genetic patterns due to common ancestry. These clusters are created using reference populations—groups of individuals with deep roots in a specific region whose DNA helps define that population.
In myOrigins®, your results are organized into a hierarchy:
- Continental Region – Broad geographic areas (for example, Europe)
- Super Population – Subregions within a continent (such as Southern Europe)
- Population Cluster – More specific genetic groups (such as the Italian Peninsula)
Each population cluster represents a reference population that your DNA is compared against to estimate your ancestral origins.
FamilyTreeDNA currently uses over 90 population clusters to model genetic variation around the world. You can view the full list of populations in the Help Center.
How Does myOrigins Work?
myOrigins estimates your ancestral origins by comparing your autosomal DNA to a set of reference populations—groups of people with shared genetic ancestry.
Population geneticists identify these groups using individuals with deep regional roots (for example, people whose grandparents all come from the same area). These groups are then tested and refined to create population clusters.
Your DNA is compared against these reference populations, and a calculation is made to estimate how closely your DNA matches each group. The results are expressed as percentages representing your genetic similarity to those populations.
Because each DNA testing company builds its own reference datasets and may analyze different sets of genetic markers, your results can vary slightly between companies.
Why Are myOrigins Results Estimates?
myOrigins results are estimates based on genetic similarity—not exact measures of where your ancestors lived.
Some regions of the world have very distinct genetic patterns, especially at the continental level or in historically isolated populations. In these cases, results tend to be more clearly defined.
Within continents, however, populations have mixed and migrated over thousands of years. Because of this, genetic differences between neighboring regions can be subtle. Your DNA may closely match multiple nearby populations, and your results will reflect the closest overall fit.
If a specific ancestral population is not represented in the reference dataset, your DNA will be matched to the nearest available population. This helps ensure your results total 100%, even if the match is not exact.
As reference populations are updated and expanded over time, your results may also change.
How Does DNA Inheritance Impact myOrigins Results?
You inherit 50% of your autosomal DNA from each parent, but you do not inherit equal amounts from each ancestor.
Because of random recombination, DNA is shuffled each generation. This means you may inherit more DNA from some ancestors and little or none from others.
As a result, your myOrigins percentages may not perfectly reflect your family tree, even when your genealogical research is accurate.
How to Read Your myOrigins Report
Your myOrigins report combines population percentages, maps, and tools to help you explore where your ancestors likely lived.
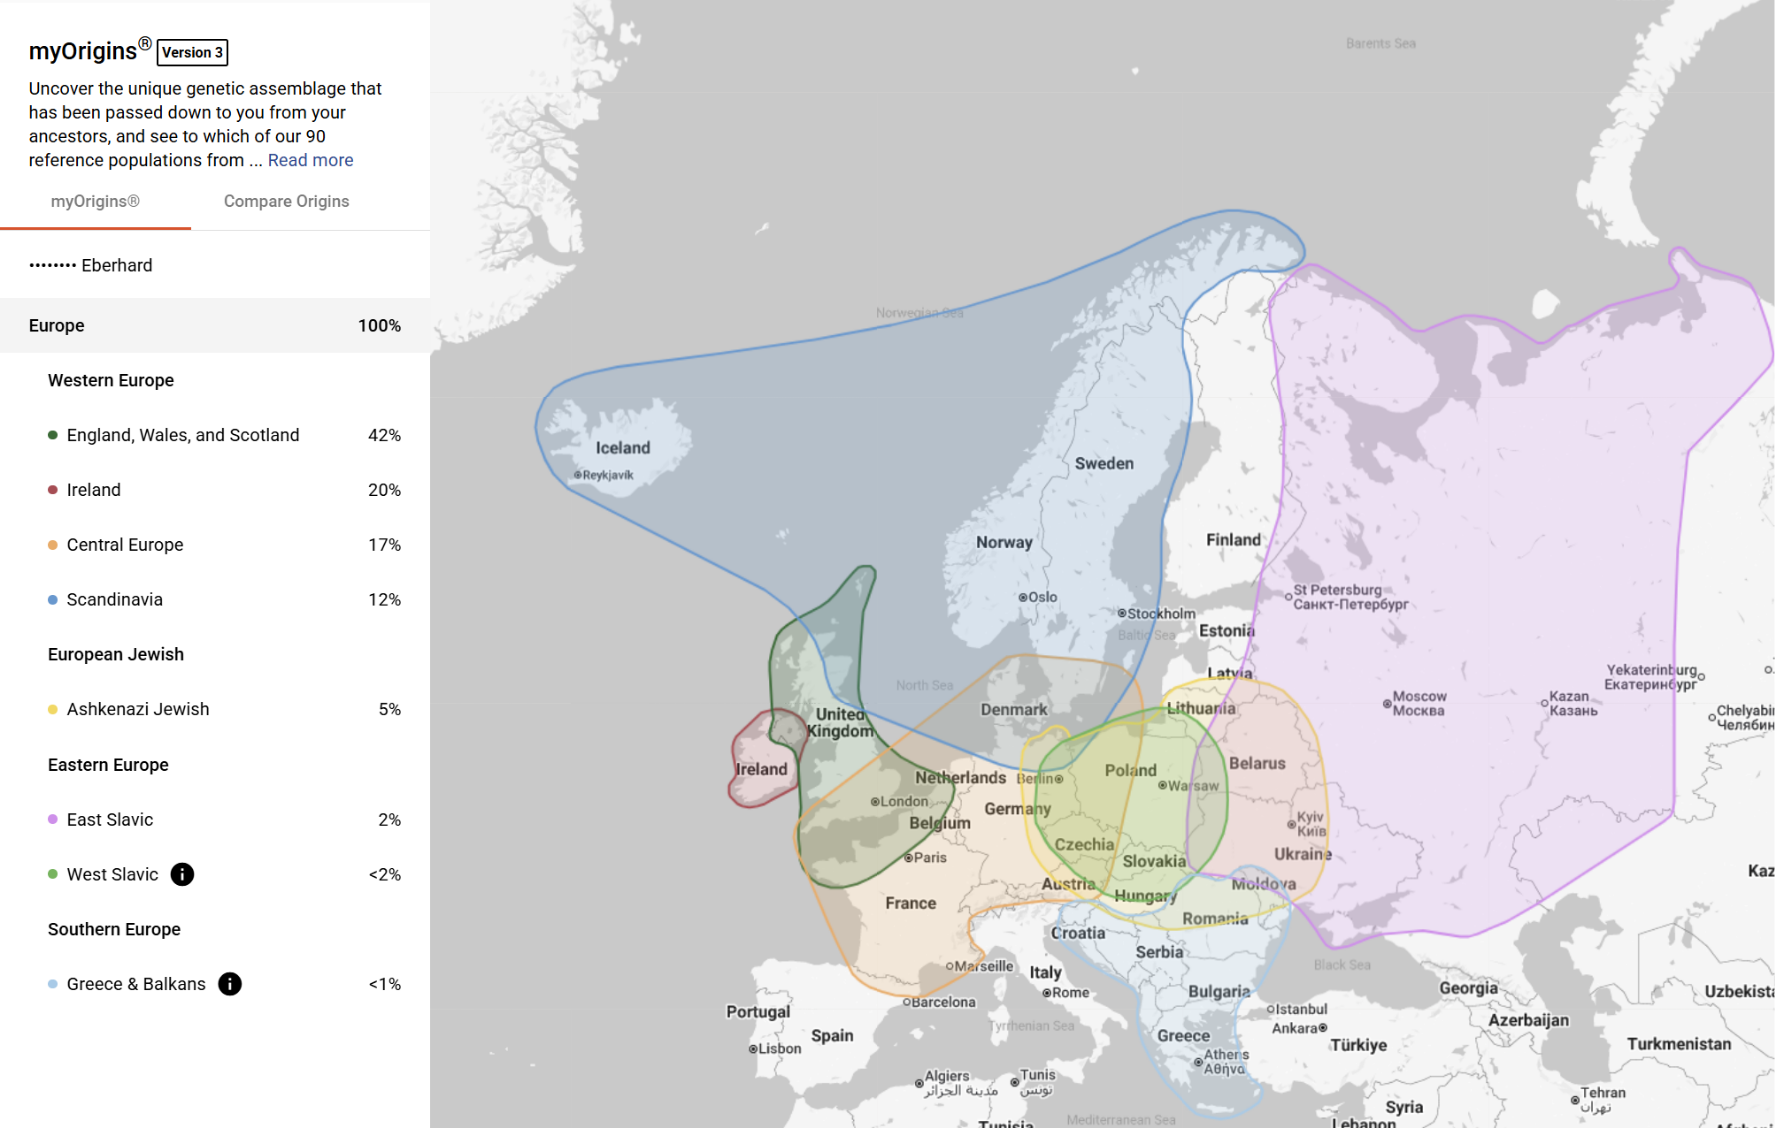
- Navigation and controls: Use the icons at the top of the report to return to your dashboard, download your results, access the Help Center, or collapse the sidebar.
- Population percentages: The left panel shows your estimated ancestral population percentages—how closely your DNA matches each reference population. These are organized into Continental Regions, Super Populations, and Population Clusters.
- Interactive map: The map displays your population clusters as color-coded regions. Each highlighted area represents a population your DNA is associated with, and you can zoom in or out to explore different regions.
- Population details: Selecting a population allows you to view additional information about that group, including geographic and historical context.
- Compare Origins tab: Switch to the Compare Origins tab to compare your results with DNA matches and map their earliest known ancestors.
What Is Compare Origins?
Compare Origins is a feature within myOrigins that allows you to compare your ancestral population results with your DNA matches. It also lets you map your matches’ earliest known ancestors to visualize shared geographic connections.
How Does Compare Origins Work?
In Compare Origins, you can:
- Compare your population results with individual DNA matches
- Filter matches by relationship level, Family Matching categories, X matches, or shared surnames
- Map your matches’ earliest known ancestors
- View maternal, paternal, or combined ancestor locations
Clicking on a map pin reveals more details about a match’s earliest known ancestor, along with options to view their profile and compare your origins.
How Can Compare Origins Help Your Research?
Compare Origins helps connect your DNA results to real-world locations and genealogical records.
You can use it to:
- Identify matches whose ancestors come from the same regions as yours
- Find geographic patterns among your matches
- Narrow down potential shared ancestors
- Support research when working with specific populations or locations
This makes it easier to move from population-level results to actual family connections.
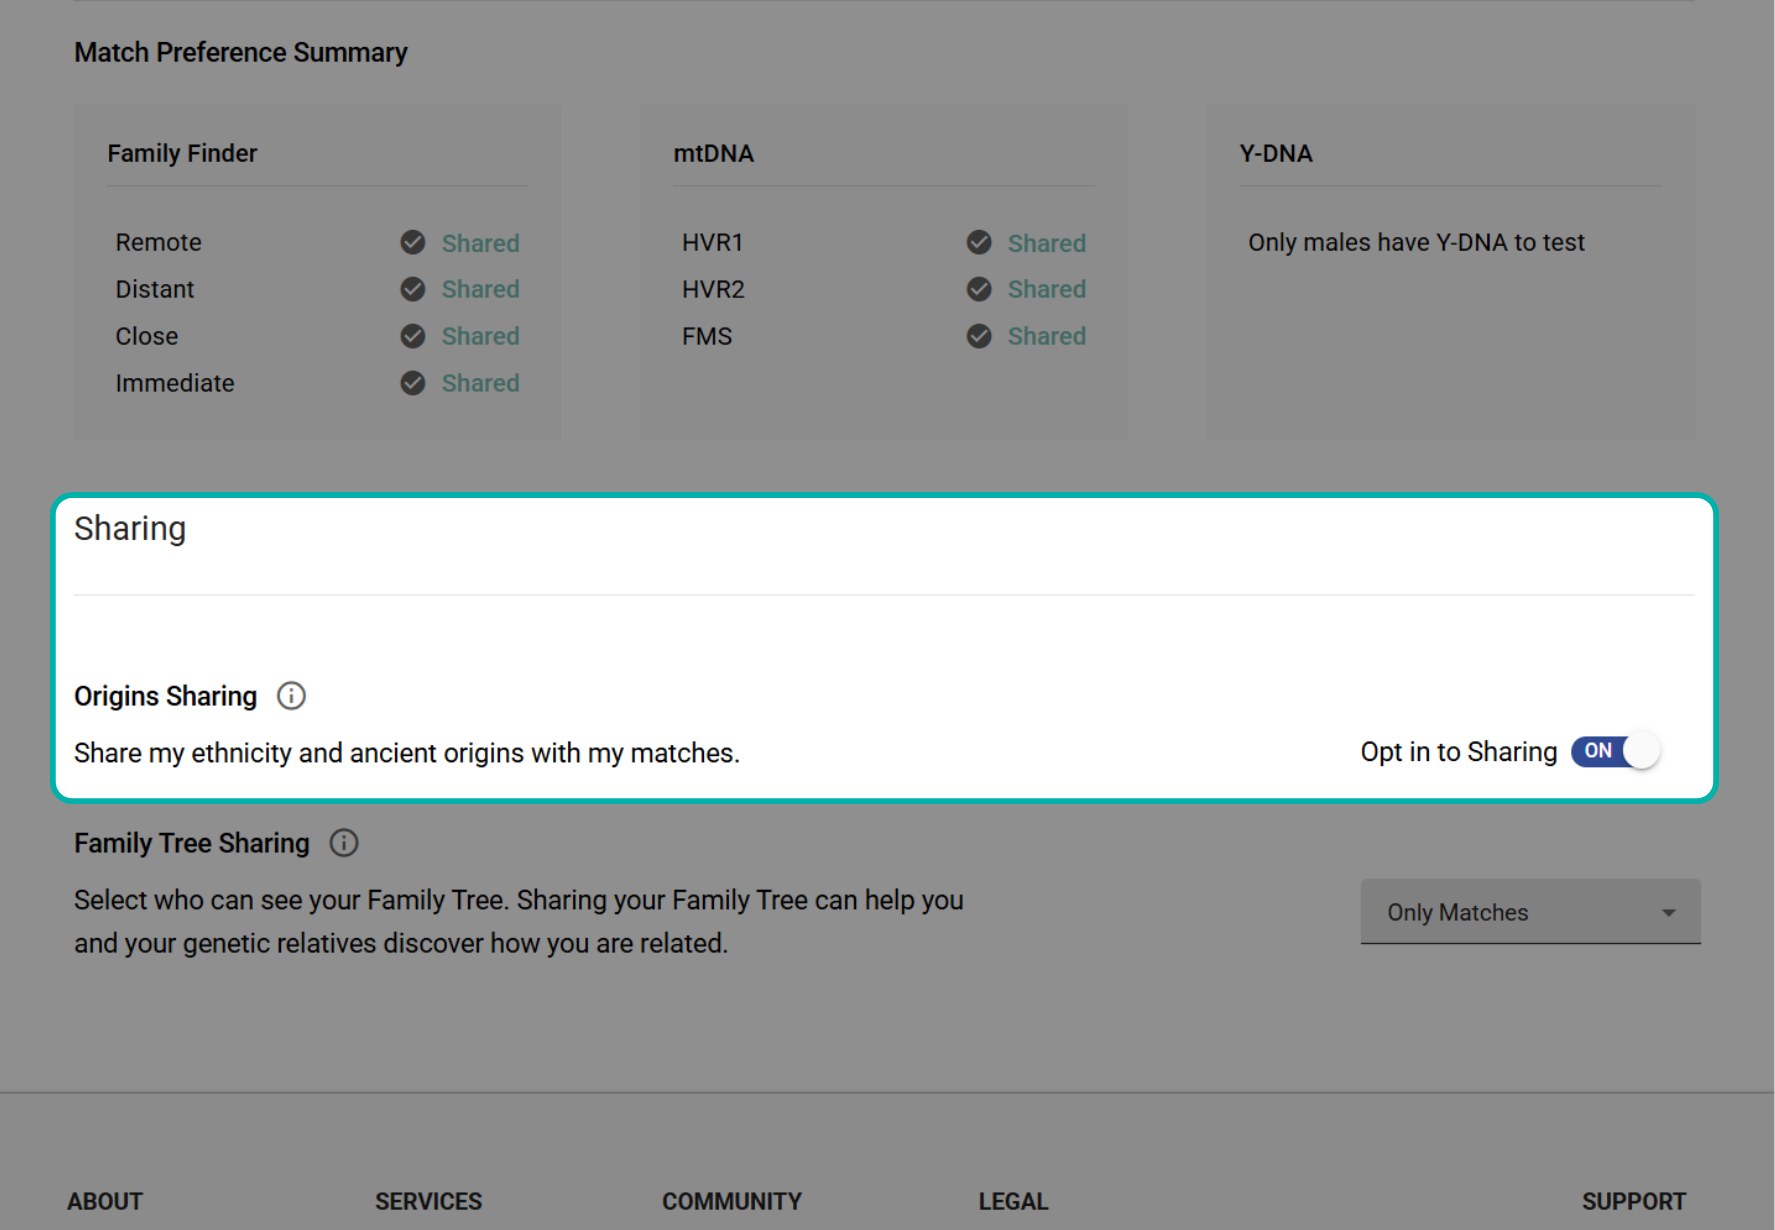
How Do You Enable Compare Origins?
To use Compare Origins, you must opt in to Origins Sharing in your account settings.
Go to Privacy & Sharing in your account and enable Origins Sharing to compare your results with matches who have also opted in.
While Compare Origins focuses on geographic patterns, the Chromosome Painter allows you to examine your ancestry at the DNA segment level.
What Is the Chromosome Painter?
The Chromosome Painter is a feature that allows you to visualize how your ancestral populations are distributed across your DNA. This tool provides a more detailed view of your ancestry than percentages alone.
To understand how this tool works, it helps to first understand what “chromosome painting” means in genetic genealogy.
What Is Chromosome Painting in DNA?
Chromosome painting is the process of assigning segments of your DNA to different ancestral populations based on genetic similarity.
Instead of only showing percentages, it maps your ancestry across your chromosomes—allowing you to see where specific population segments appear in your DNA.
How Does Chromosome Painter Work?
Your autosomal DNA is divided into segments, and each segment is compared to reference populations.
The Chromosome Painter assigns each segment to the population it most closely matches and displays those segments across your 22 autosomal chromosomes.
Because neighboring populations often share similar DNA, these assignments are estimates and may reflect closely related regions.
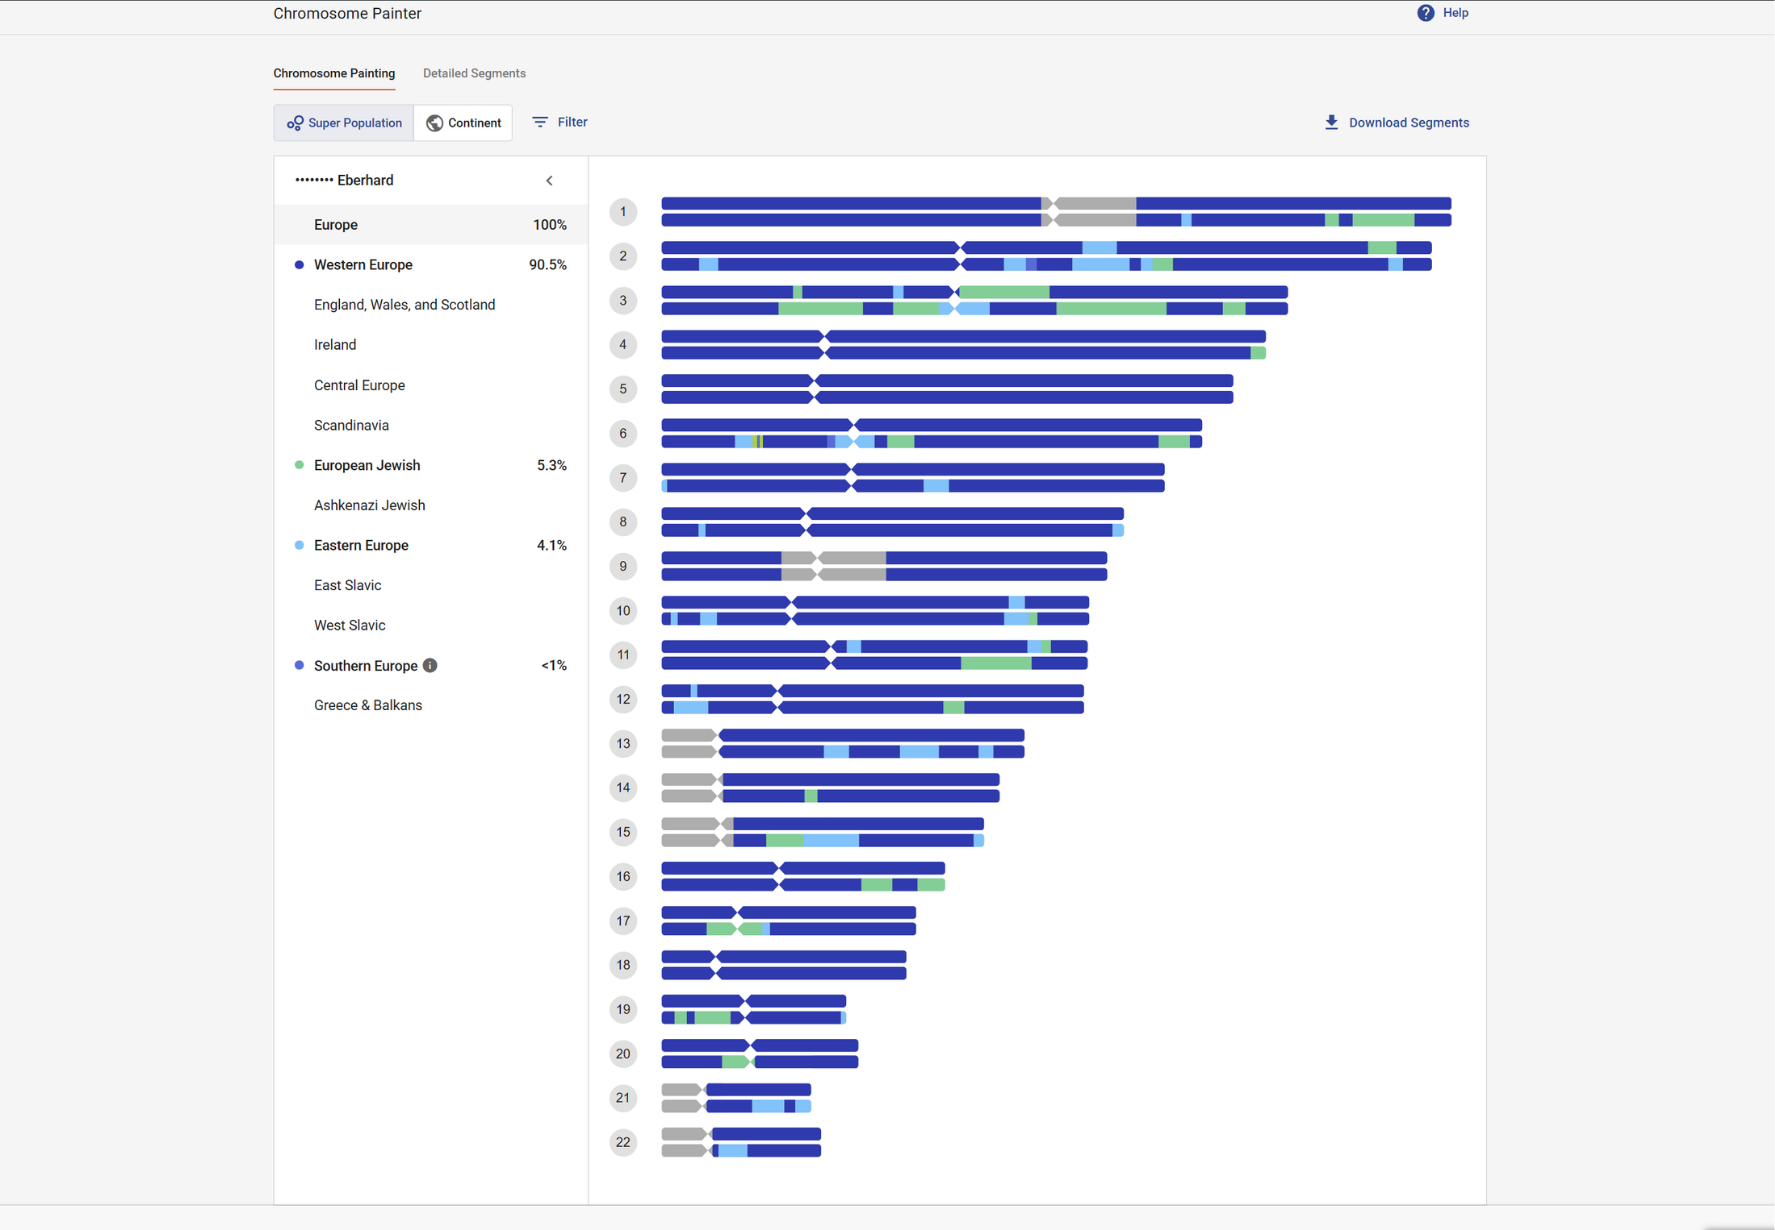
How to Use the Chromosome Painter
Once your DNA has been assigned to population segments, you can explore those results visually using the Chromosome Painter interface.
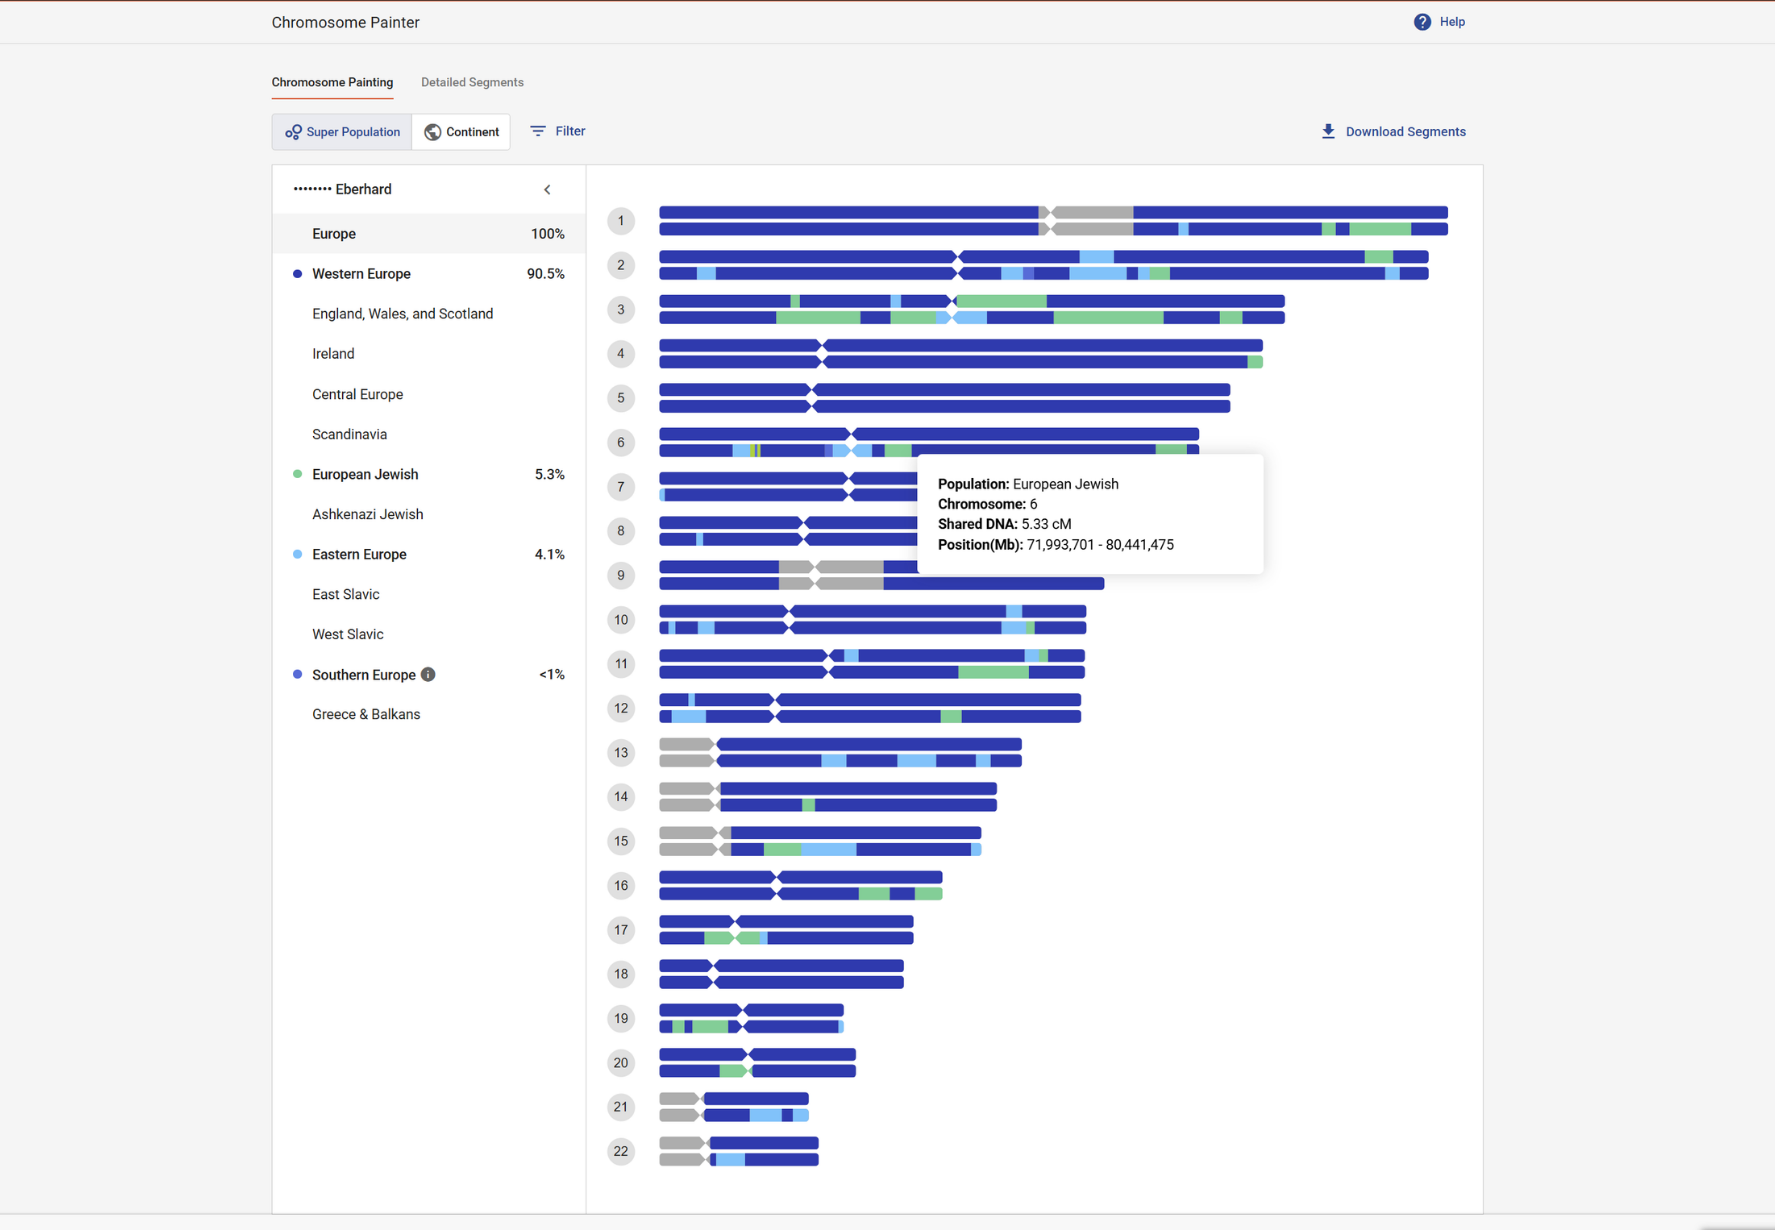
- Chromosome view: Your 22 autosomal chromosomes are displayed with color-coded segments. Each color represents a population your DNA is associated with.
- Population breakdown: A legend or sidebar shows which populations correspond to each color, along with your overall percentages.
- Display options: You can switch between continent-level and super-population views, adjust layout, and filter which populations are displayed.
- Segment details: Clicking on a segment reveals more information, including:
- Population assignment
- Chromosome number
- Segment size (centimorgans)
- Start and end positions
What Is the Detailed Segments View?
The Detailed Segments view presents your chromosome painting data in a table format.
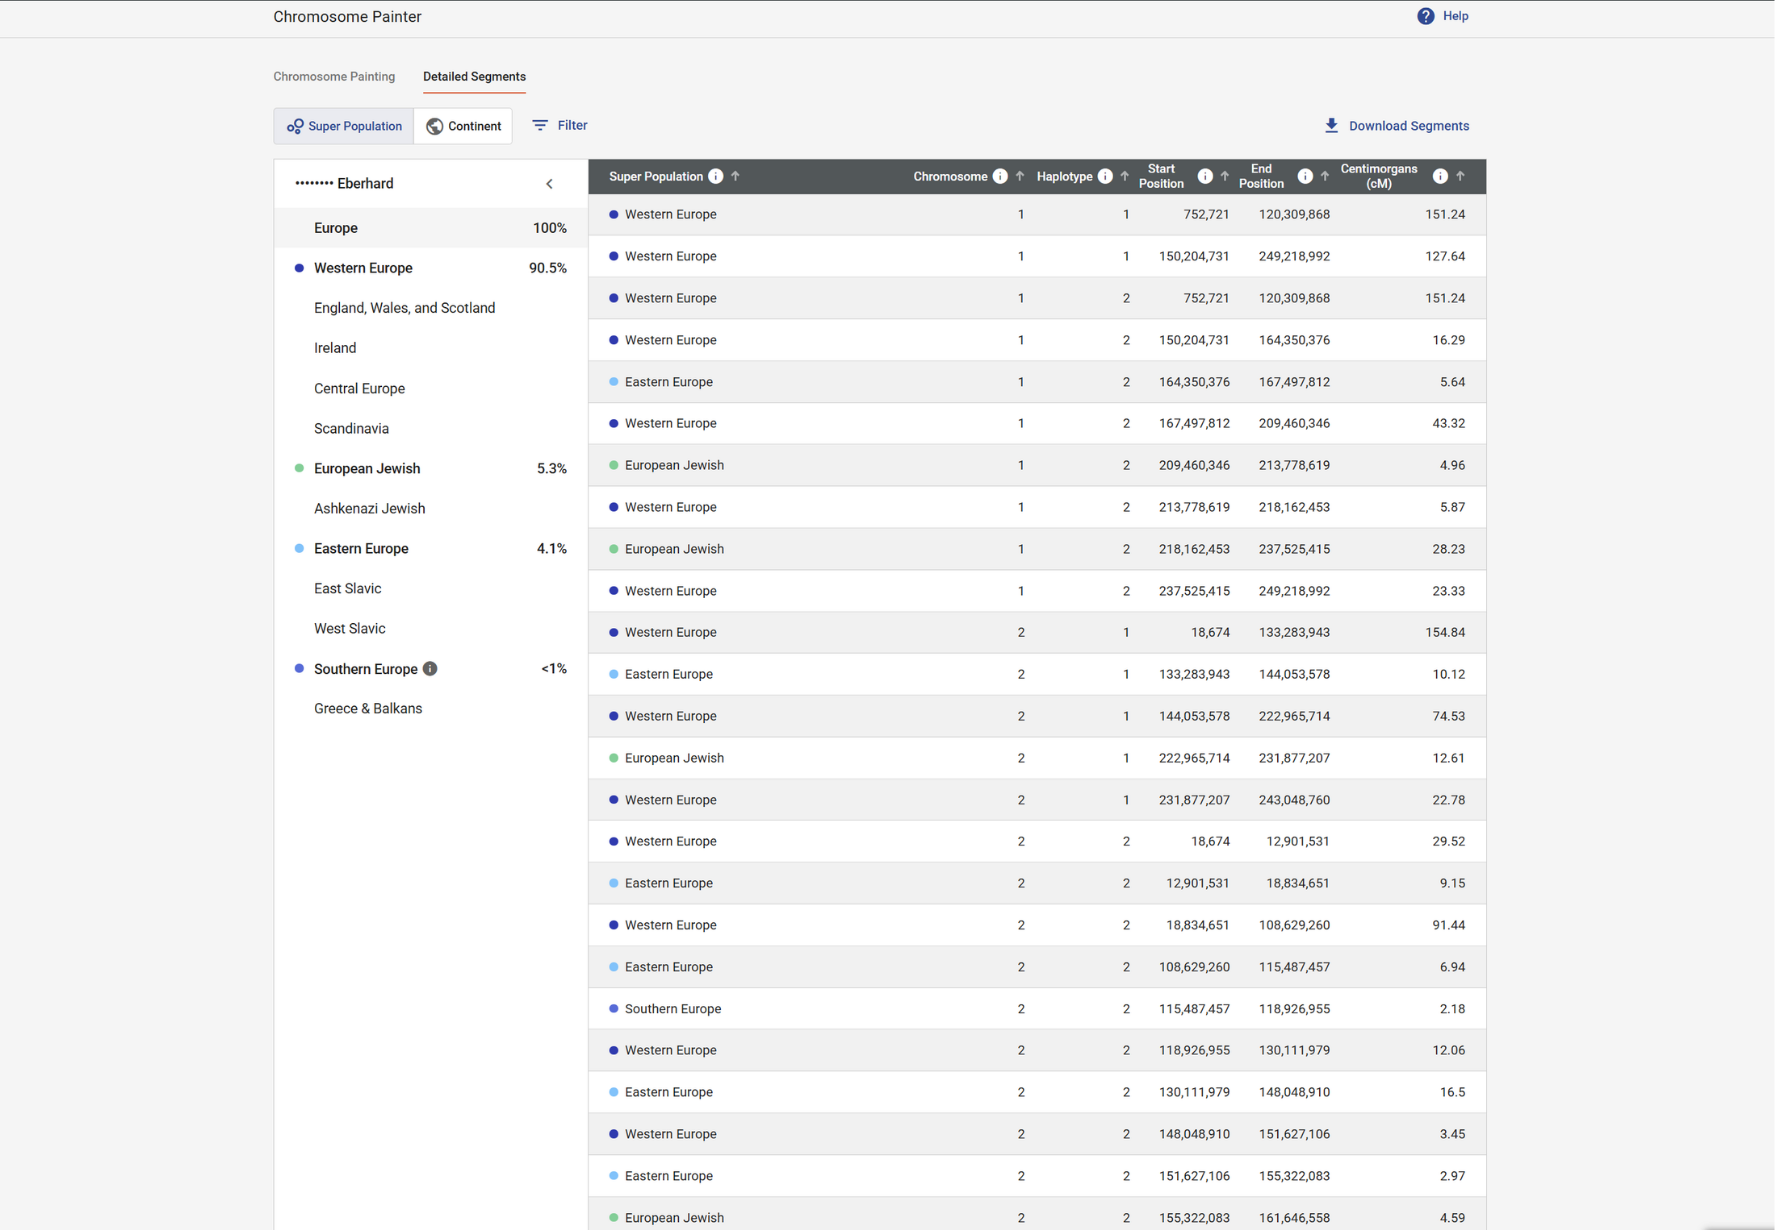
- Population: The population assigned to the segment
- Chromosome: Which chromosome the segment is located on
- Haplotype: One of your two chromosome copies
- Start and end positions: Where the segment begins and ends
- Centimorgans (cM): The size of the segment
Segments with higher centimorgan values are typically inherited from more recent ancestors.
How to Use Chromosome Painter for Research
The Chromosome Painter helps connect your population results to specific DNA segments that you share with matches.
You can use it to:
- Identify segments associated with a specific population
- Compare those segments with DNA matches in the Chromosome Browser
- Look for overlapping segments (triangulation)
- Trace shared segments back to a common ancestor
It can also be used alongside Compare Origins to combine geographic and genetic evidence when researching your family history.
What Is ancientOrigins?
The ancientOrigins feature compares your autosomal DNA to DNA recovered from archaeological sites to provide insight into your deep ancestral connections.
While myOrigins focuses on more recent populations (within the past ~500–2,000 years), ancientOrigins looks much further back—analyzing genetic similarities to populations from approximately 4,000–8,000 years ago.
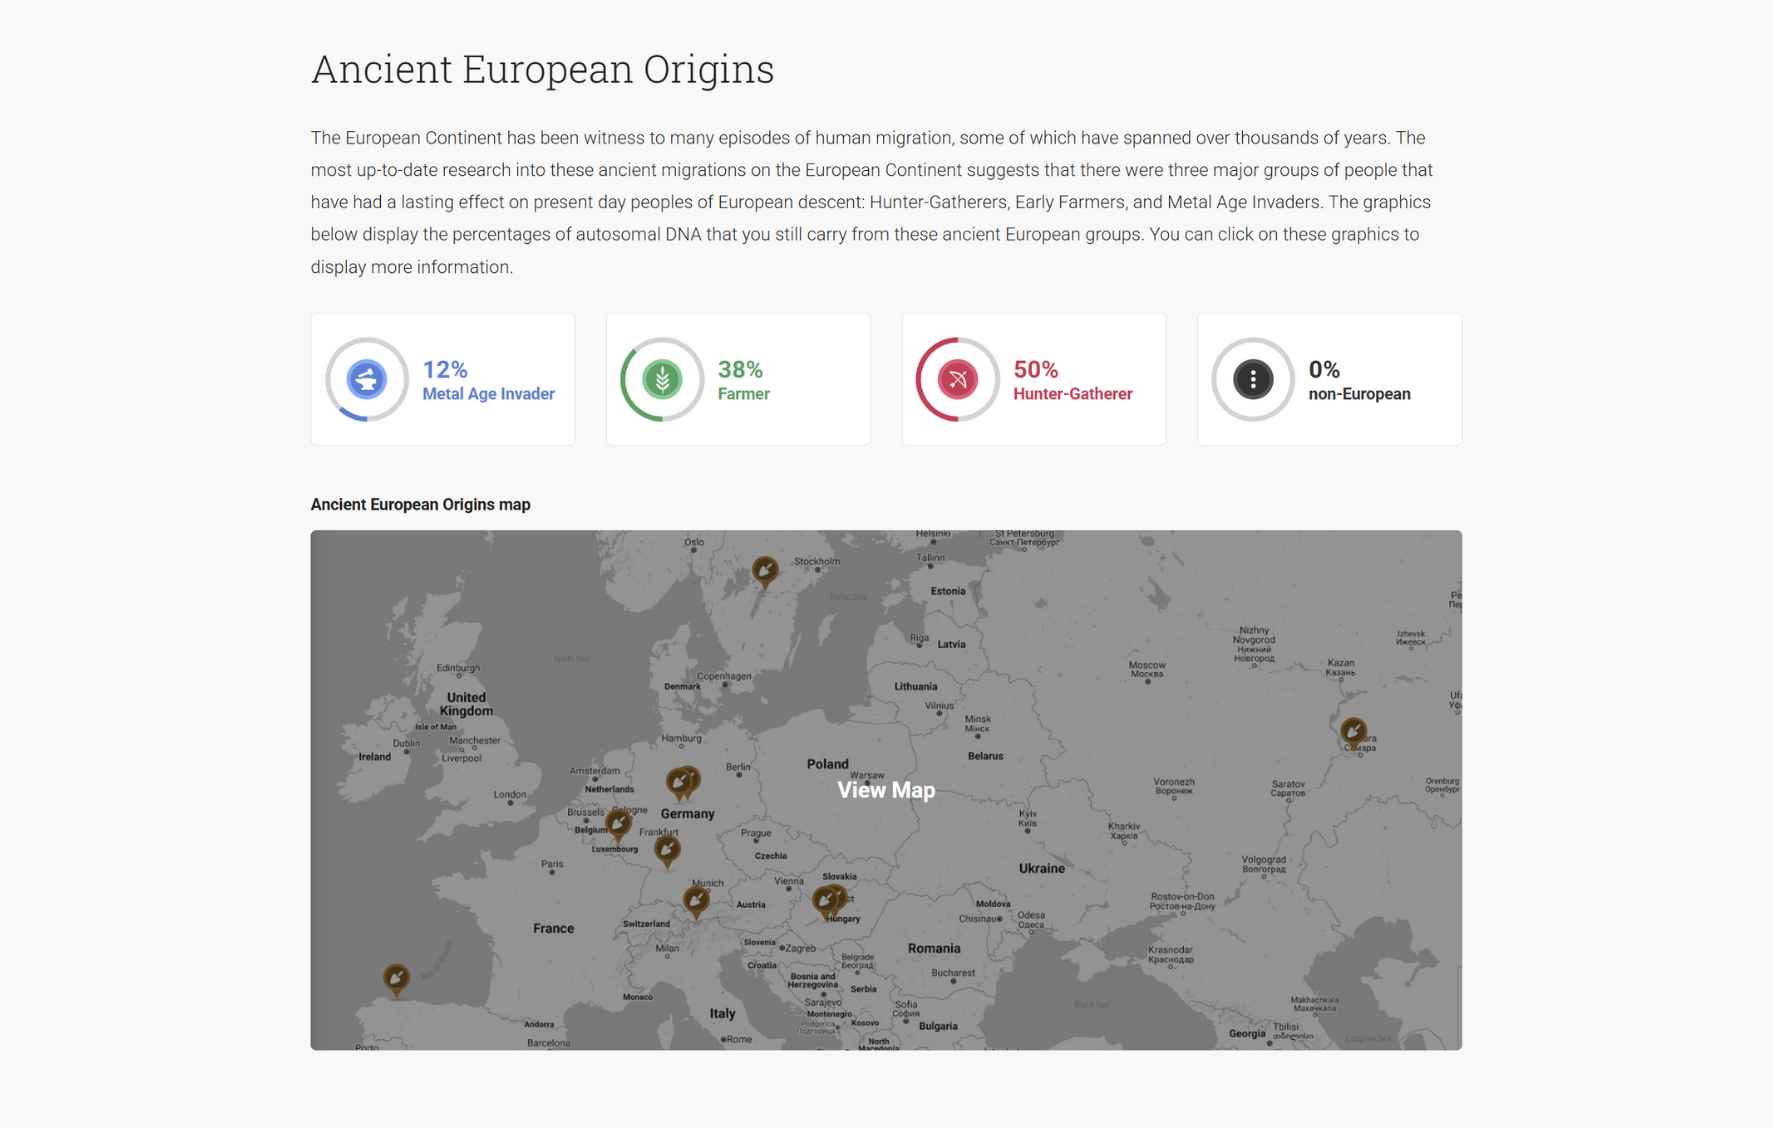
How Does ancientOrigins Work?
ancientOrigins compares your DNA to ancient samples from archaeological sites, primarily across Europe.
Your results are presented as percentages reflecting your genetic similarity to three major ancestral groups associated with migrations into Europe:
- Hunter-Gatherers (Mesolithic and early Neolithic)
- Farmers (Neolithic)
- Metal Age Invaders (Bronze Age)
These groups represent broad population movements that shaped the genetic landscape of Europe.
How to Interpret ancientOrigins Results
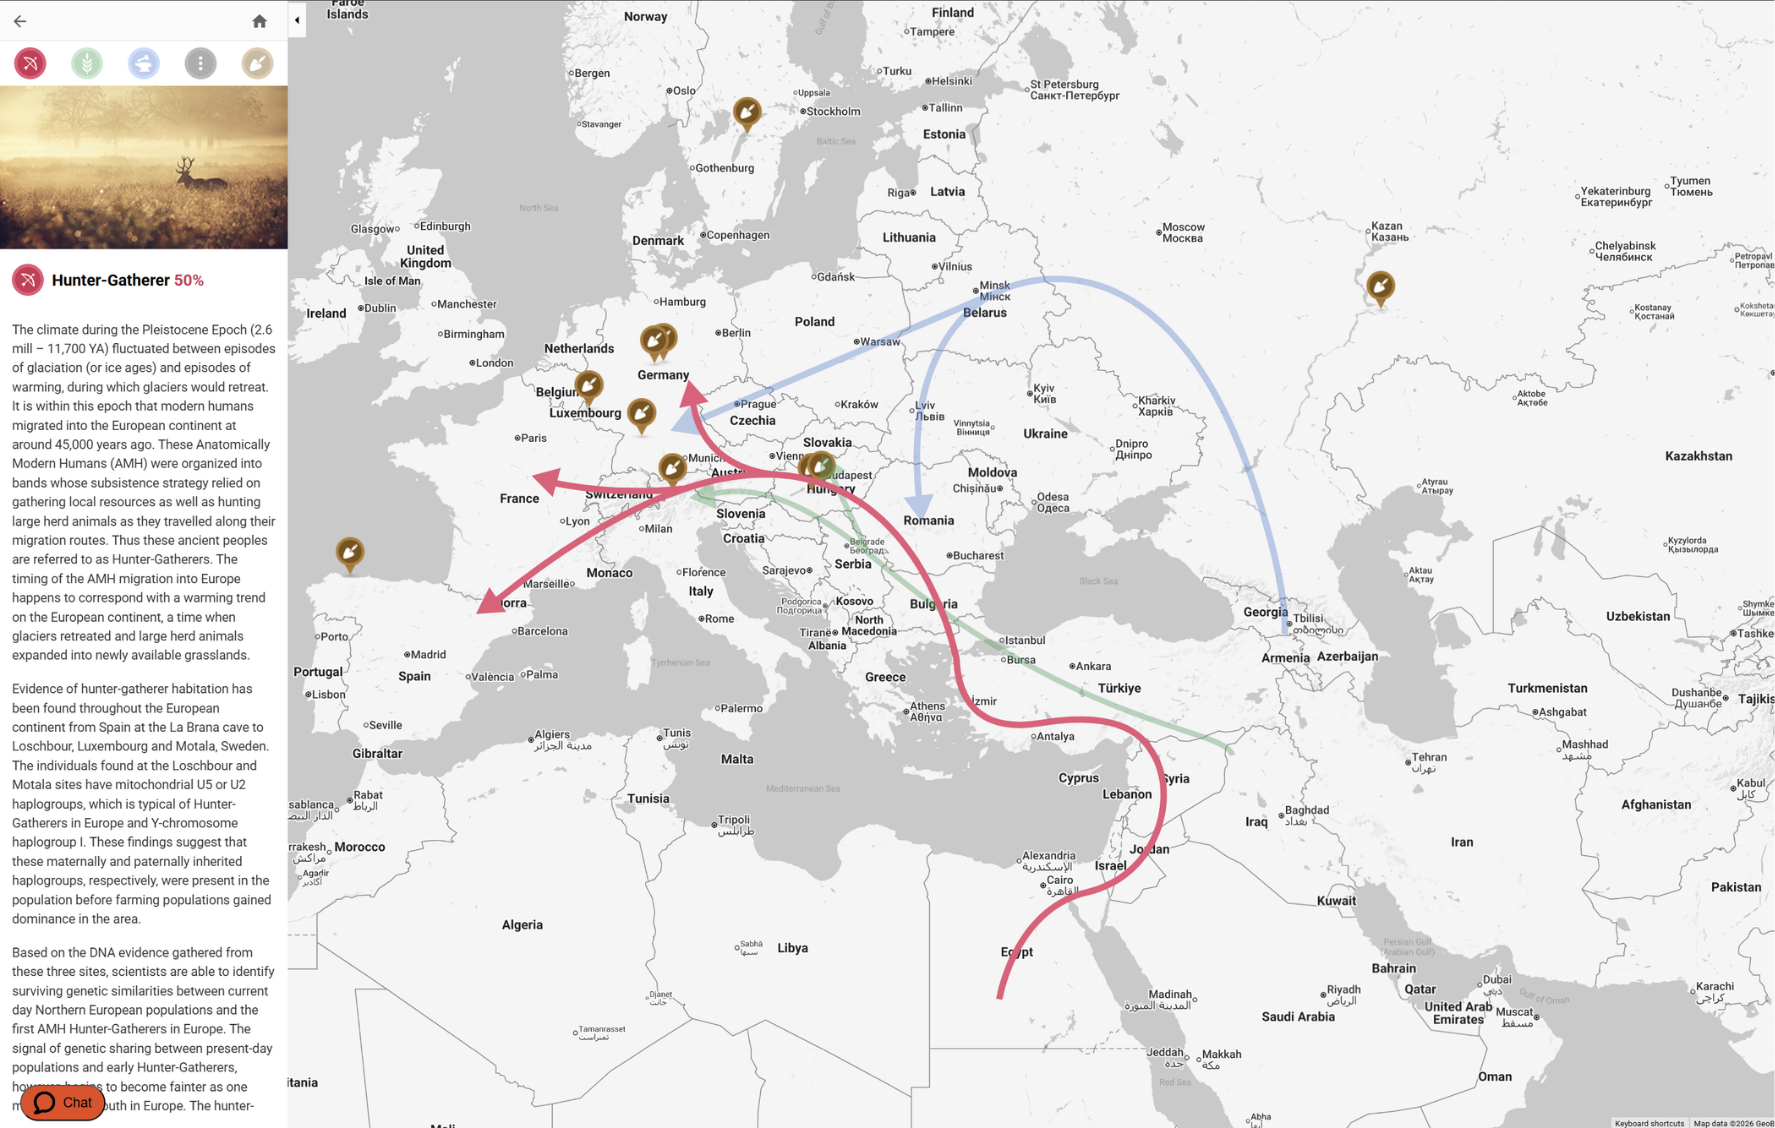
Your ancientOrigins results may not match your myOrigins percentages—and that’s expected.
- Different timeframes: ancientOrigins reflects ancient populations from thousands of years ago, while myOrigins focuses on more recent ancestry.
- Different reference data: Each report compares your DNA to different sets of populations, so the results are not directly comparable.
- Regional scope: Because ancientOrigins currently focuses on European archaeological samples, you may see little or no representation of non-European ancestry in this report.
You can explore individual archaeological sites by clicking on markers within the map to learn more about each ancient population.
What Is a Y-DNA Haplogroup?
Your Family Finder results (and autosomal transfers) may include a Y-DNA haplogroup, providing insight into your direct paternal ancestry.
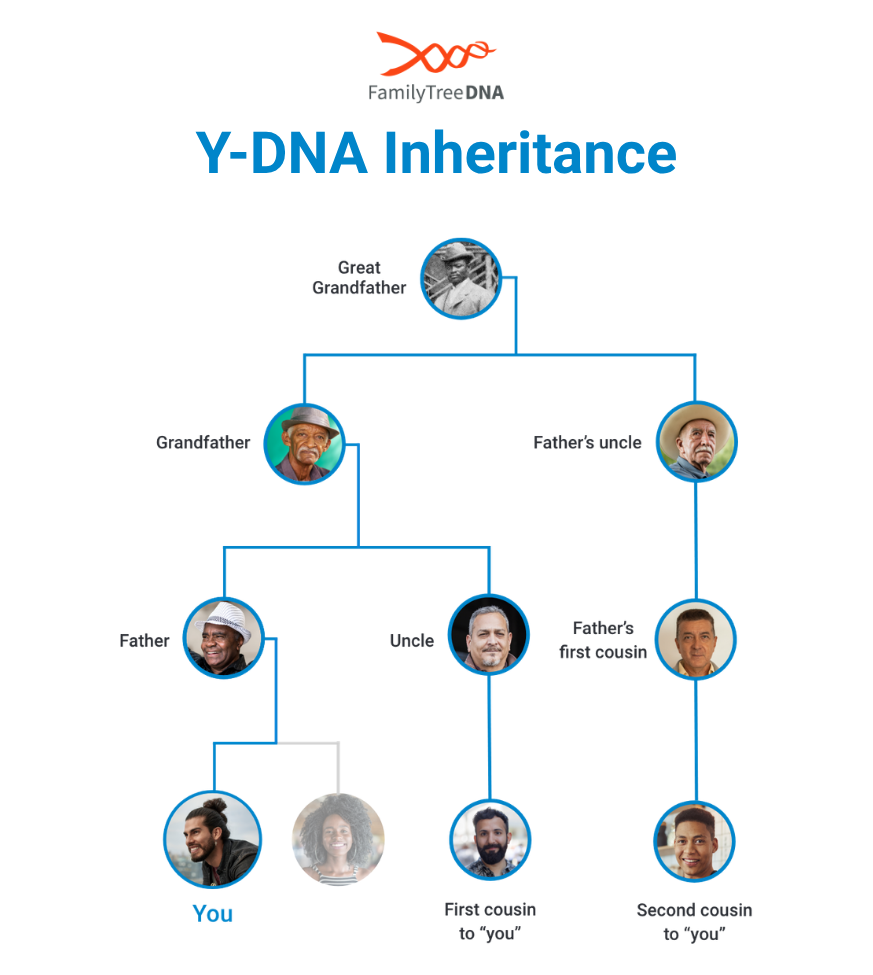
A haplogroup is a branch on the Tree of Humankind that represents a line of descent from a common ancestor. Y-DNA haplogroups trace your direct paternal line—from father to son—across thousands of years.
These haplogroups are associated with ancient human migrations and can often be linked to specific geographic regions.
How Does Family Finder Provide Haplogroups?
Family Finder includes analysis of Y-DNA markers, which allows a partial Y-DNA haplogroup to be provided for genetic males.
This haplogroup offers insight into your direct paternal lineage—your father’s father’s father’s line—and connects your DNA to a broader human story that extends far beyond recent genealogy.
(Note: Family Finder results may include a partial haplogroup. For more detailed results, a dedicated Y-DNA test provides deeper resolution.)
What Can a Y-DNA Haplogroup Tell You?
Your Y-DNA haplogroup provides access to additional Y-DNA Discover tools and reports that help you explore your paternal ancestry in more detail.
These include:
- Haplogroup Story: Learn where your haplogroup originated and when it formed
- Country Frequency: See where related descendants are found today
- Migration Map: Trace your paternal line through ancient migrations
- Ancient Connections: Discover links to archaeological remains
- Notable Connections: Explore distant connections to historical or modern individuals
- Ancestral Path: Follow your direct paternal line through time
- Classic Time Tree: Explore your Y-DNA Haplotree from ancient origins to more recent branches in a streamlined, mobile-friendly view
- Compare Haplogroups: Compare two haplogroups to better understand how they relate to one another
How to Use Haplogroups in Genealogy
Y-DNA haplogroups can help you:
- Confirm or refine your direct paternal lineage
- Identify connections between families with shared paternal ancestry
- Recruit or collaborate with matches for Y-DNA testing
- Add deeper historical context to your family tree
They are especially useful when combined with autosomal DNA results and traditional genealogical research.
Frequently Asked Questions About DNA Ethnicity and Origin Results
Are DNA ethnicity results accurate?
DNA “ethnicity” results—more accurately called ancestral population estimates—are generally reliable at broad levels but less precise for specific regions due to historical migration and shared ancestry. They should be used as estimates, not exact measures.
Why do DNA “ethnicity estimates” vary between companies?
Different companies use different reference populations and methods, so your results may vary. Each estimate reflects the specific dataset your DNA is compared against.
How far back do DNA origin results go?
myOrigins reflects recent ancestry from about 500–2,000 years ago, while ancientOrigins looks deeper, around 4,000–8,000 years ago. These timeframes reflect population history, not specific ancestors.
Why don’t my DNA results match my family tree?
DNA is inherited through random recombination, so you may not receive DNA from every ancestor. This can cause differences between your genetic results and your documented family tree.
Why do my DNA results change over time?
DNA results can change as reference populations are updated and expanded. These updates refine your results based on improved data.
Can DNA determine your ethnicity?
No—DNA cannot determine ethnicity in a cultural or social sense. It estimates ancestry by comparing your DNA to genetic reference populations.
Understanding your autosomal DNA origin results helps add geographic and historical context to your family tree. By learning how to interpret tools like myOrigins, Chromosome Painter, ancientOrigins, and haplogroups, you can begin to see how your ancestry connects across time and place.
These results work best when combined with your DNA matches and genealogical research, giving you a more complete picture of your family history.
Next, we’ll explore how to use autosomal DNA alongside traditional genealogy, as well as Y-DNA and mtDNA, to answer real family history questions.